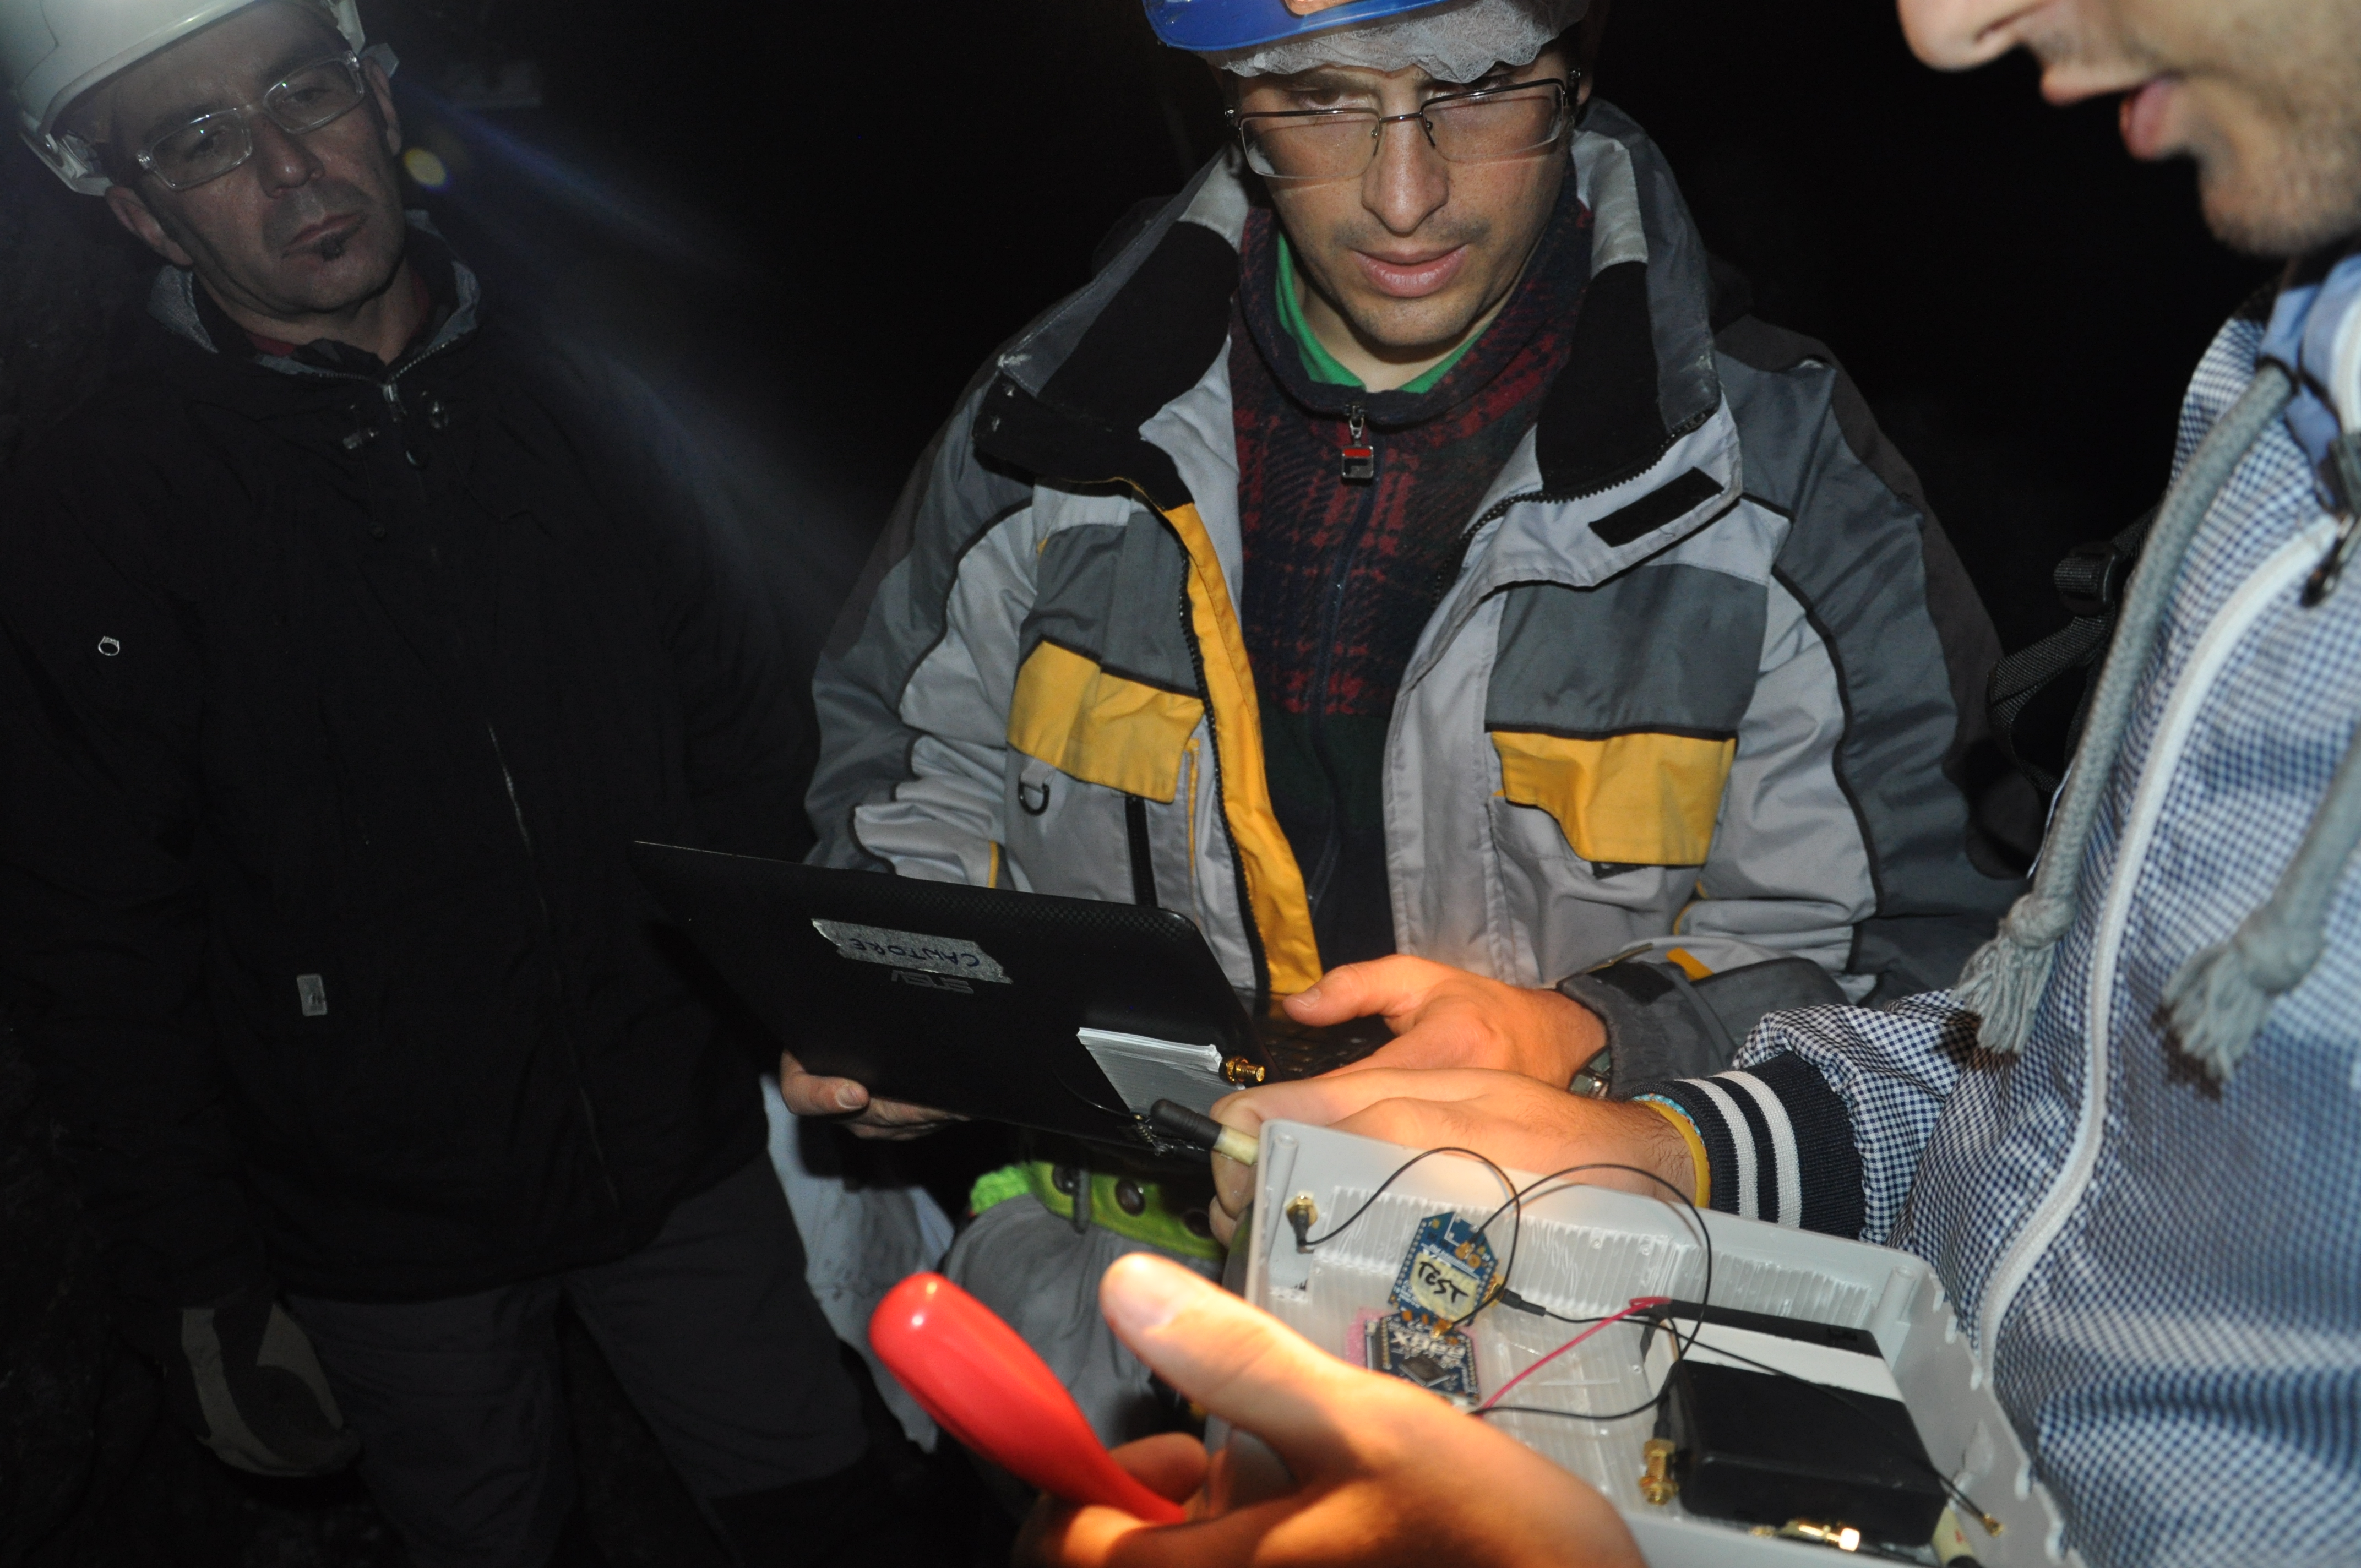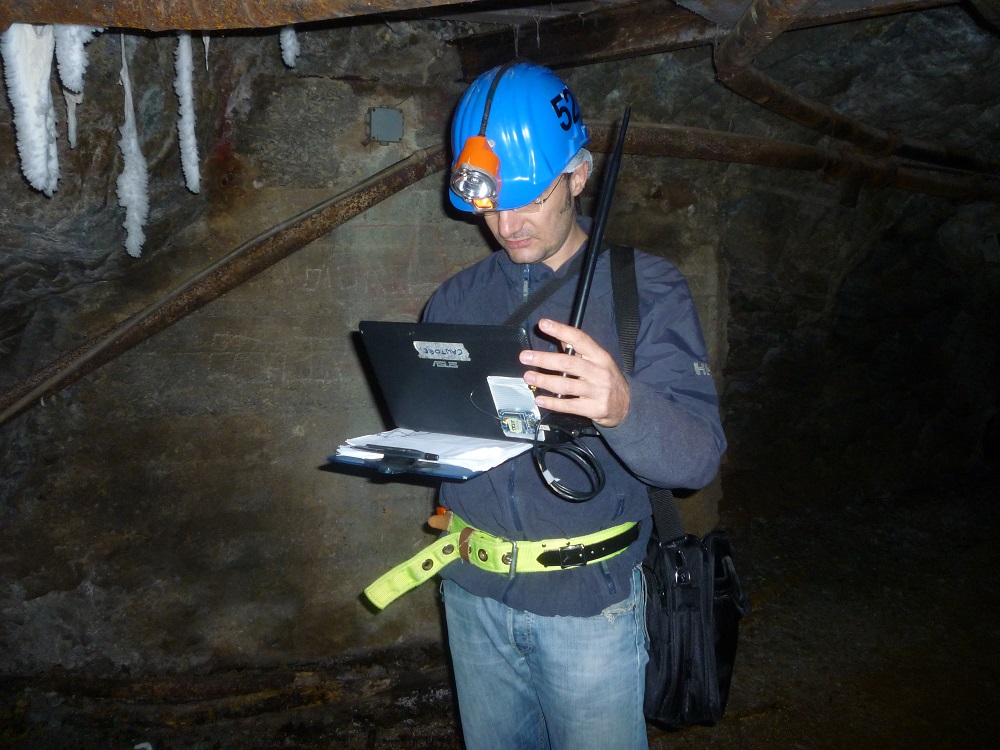
 Our test was concentrated on the reliability of Scatol8® peripheral units, in two points of the mine. We had a first view on the “health condition” of the units on October 23rd, by a visual check and a data downloading, already published here.
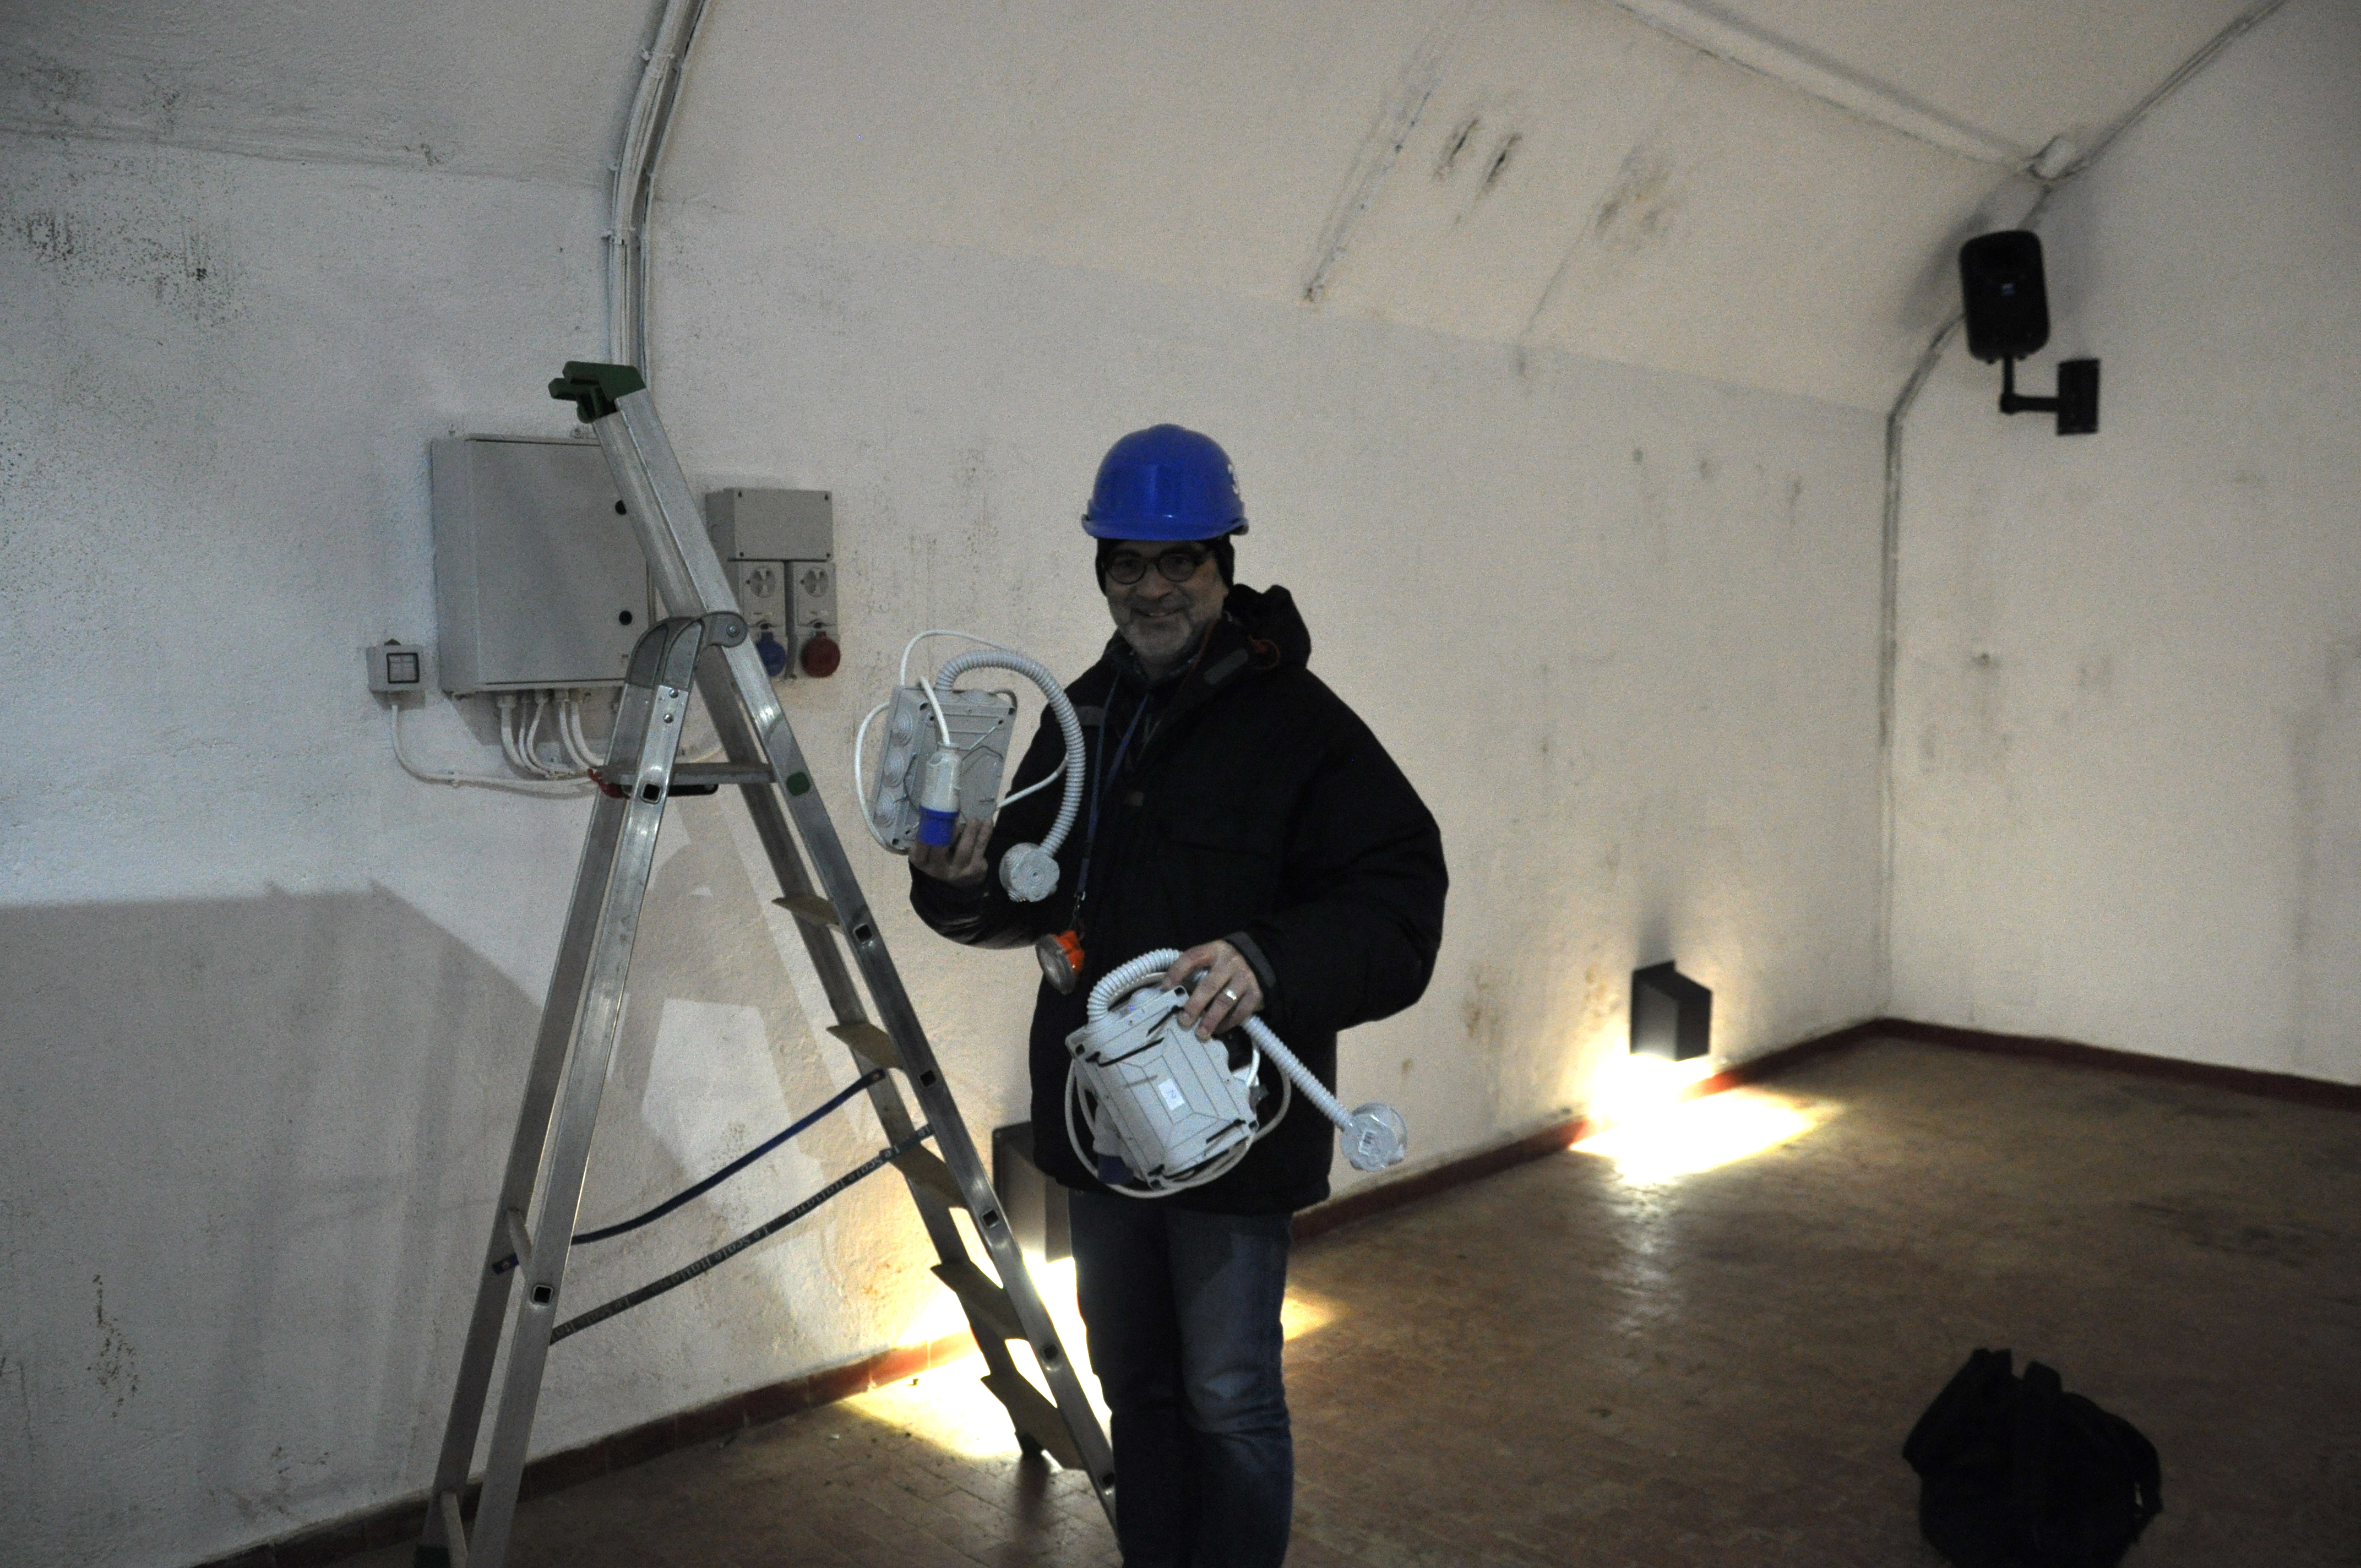
At that time, we worked on the peripheral units into the mine and left them there. On November 21st, we removed them, as the next step of our research program foresees a significant update of the hardware, without wishing to anticipate too much.
 As at the beginning of the on site program there was a serious question mark on the reactions of electronic components and circuits to the microclimate of the mine, we chose low cost sensors, such as temperature and humidity rate. Nevertheless, these variables provide useful indication to the management and, above all, to tourists.
If we look  at graphs reported in Table 1 and 2, we can say that reliability test has been passed. Raw data show a temporal continuity of detection, that is peripheral units were in top shape!
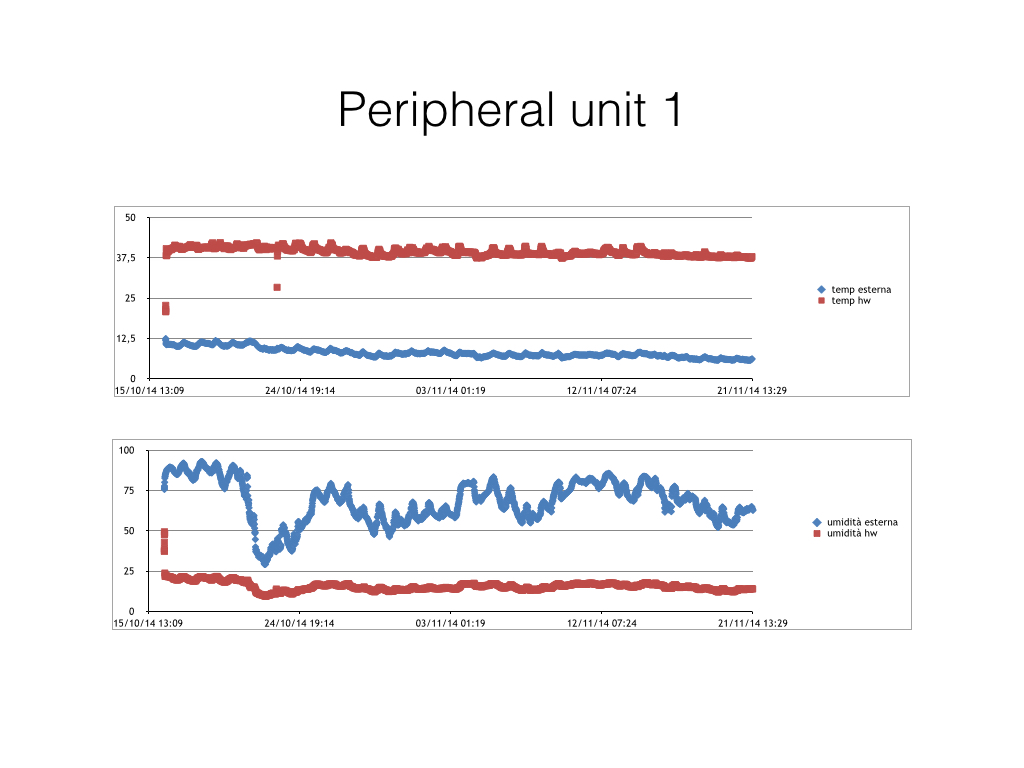
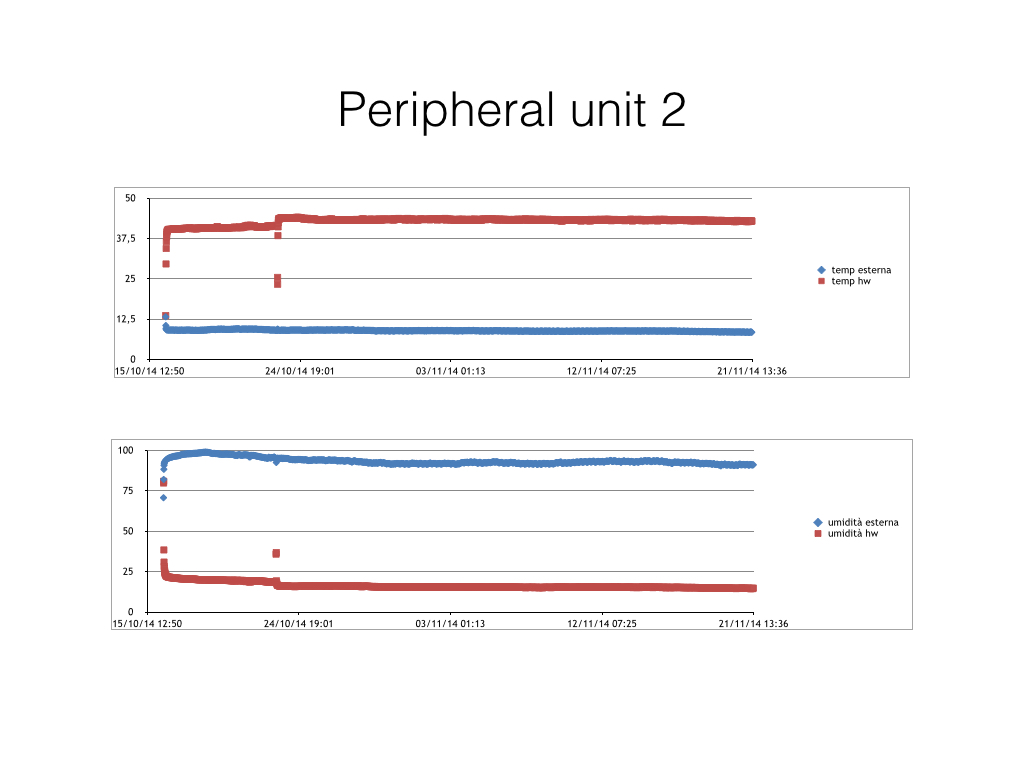
Temperature and humidity rate trends over time show a different level of variability. We can say that raw data describe two landscapes, depending on the proximity to the mine entrance of peripheral units. In spite of this, both of them kept a lower level of variability inside the boxes, meaning that we have found the right answer to the problem of microclimate.
From raw data, through a clean up operation, we could have a better understanding of the real variability, but this is not the place neither the goal of the test.